Hydrilla Infestation Statistics and Data
A comprehensive look at the numbers behind the hydrilla invasion: affected acreage, growth rates, economic costs, and geographic spread statistics.
The Scope of the Invasion
Understanding the true scale of the Hydrilla verticillata invasion requires looking at the raw data. Since its introduction in the 1950s, hydrilla has proven to be one of the most statistically overwhelming invasive species in North America.
Researchers track hydrilla's impact through several key metrics: acreage affected, growth rates, reproductive capacity, and economic management costs.
Growth and Reproduction Statistics
- Vertical Growth Rate: Up to 1 inch per day under ideal conditions.
- Biomass Production: A heavy infestation can produce over 130 tons of wet biomass per acre.
- Water Composition: Hydrilla plants are approximately 90-95% water by weight, making mechanical removal incredibly inefficient and heavy.
- Tuber Density: Research has shown densities of 4,000 to 6,000 subterranean tubers per square meter in heavily infested sediments.
- Tuber Longevity: Tubers can remain viable in undisturbed sediment for 4 to 7 years.
Geographic and Economic Data
The financial and geographic statistics underscore why state agencies consider hydrilla a top-tier threat:
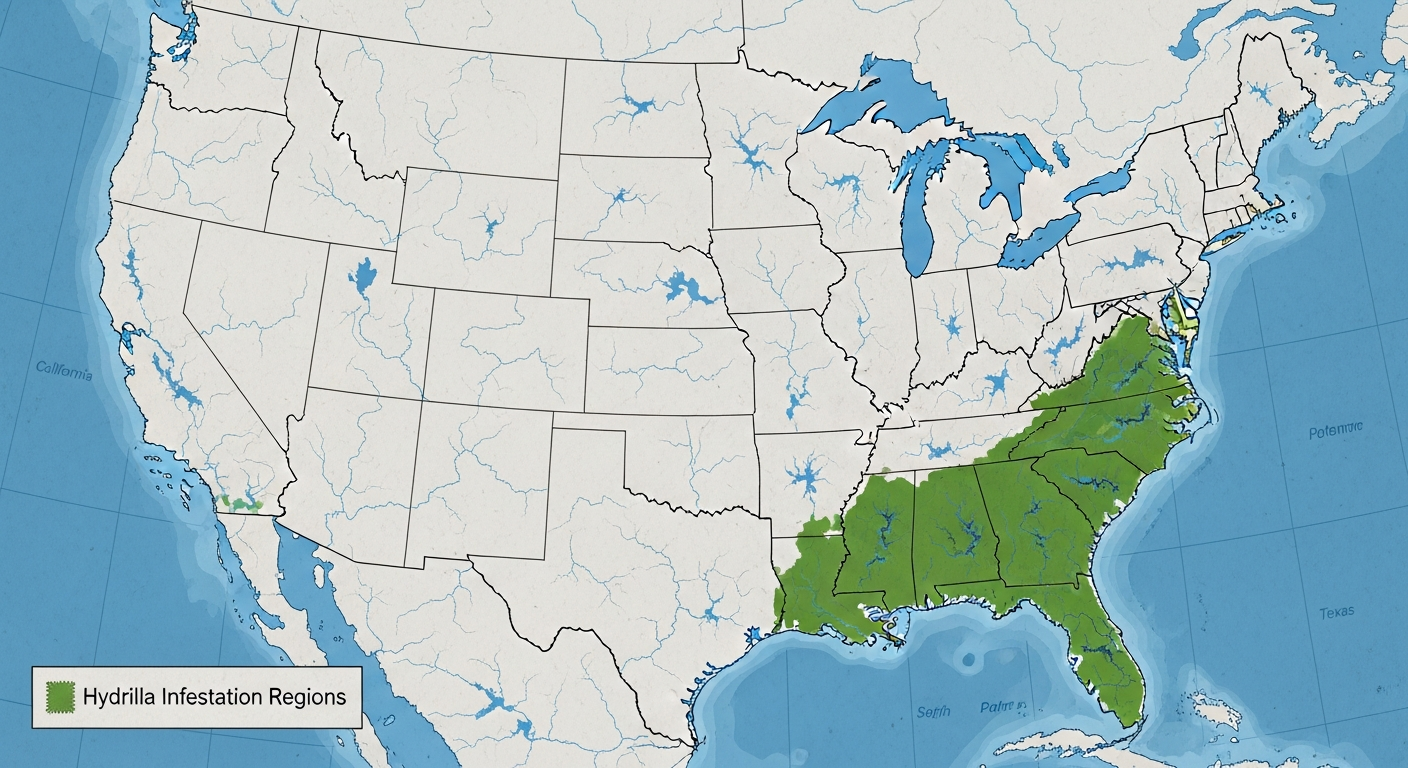
- Geographic Spread: Found in at least 33 states. The dioecious biotype dominates the South, while the monoecious biotype has pushed into northern climates.
- Florida's Burden: At its peak in the late 1990s, hydrilla covered nearly 100,000 acres of Florida's public waters. Today, aggressive management keeps it closer to 20,000 acres, but at a massive cost.
- Annual Spending: The state of Florida routinely spends $15 million to $30 million annually simply to manage hydrilla on public waters.
- National Cost: When factoring in private lake treatments, lost recreational revenue, and infrastructure damage, the national economic impact is estimated in the hundreds of millions of dollars annually.
Explore Related Topics
References
Information presented on this page is supported by peer-reviewed research, federal agencies, and state resource management programs.
- U.S. Geological Survey (USGS) – Nonindigenous Aquatic Species Databasehttps://nas.er.usgs.gov
- U.S. Army Corps of Engineers – Aquatic Plant Control Research Programhttps://www.erdc.usace.army.mil
- NOAA Aquatic Invasive Species Programhttps://www.noaa.gov